Today the topic of class was inverses. We discussed how the graph of an inverse is simply a reflection over the y=x axis. Below are some example of that, along with the equation which generates the graph, as well as the inverse.
At first, I did not understand what Mr. Newman meant by "reflection" and I couldn't picture these in my head, so I went to this website to try some reflections and created these three pictures to help my understanding:
After that, I decided to test this out on real functions. The graphs were made using the Desmos graphing calculator. The red is the original function, the green is inverse, which you notice is reflected over the black line, or y=x.
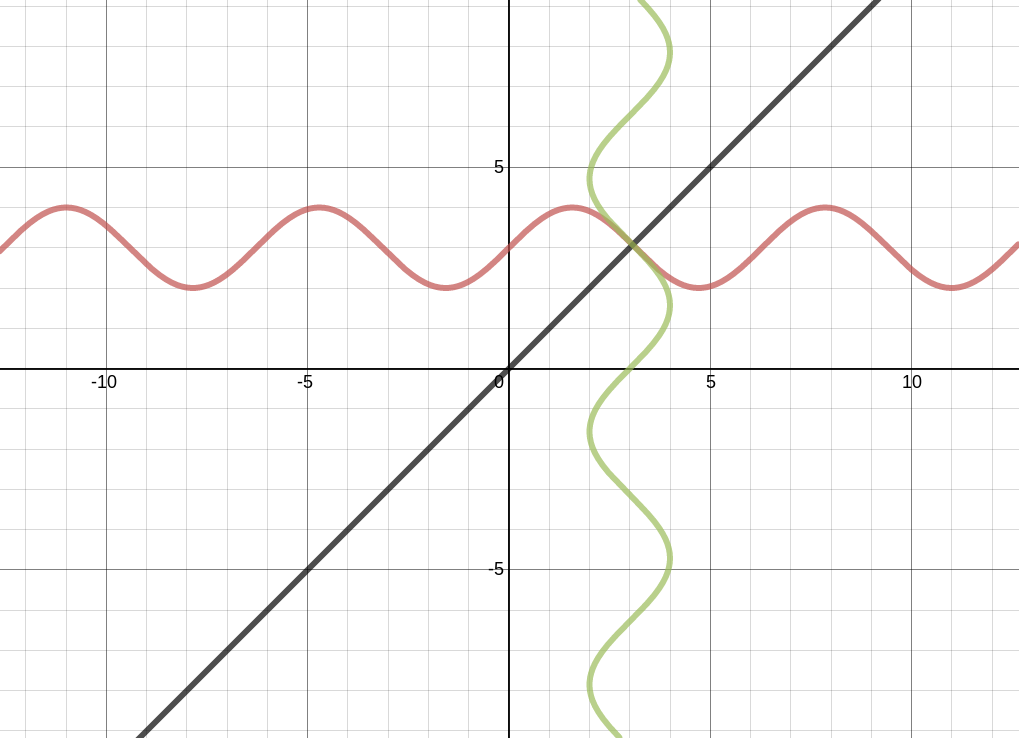
y=sin(x)+3
y=sin^-1(x-3)
y=x

y=x^2-3
y=+/- sqrt(x+3)
y=x
For the two Desmos graphs, I graphed them by switching the x and y (Desmos can graph that!). For this blog, I solved for y so that both equations were in a more standard form.
No comments:
Post a Comment